2023 Heat Mapping Campaign
The Urban Heat Island mapping campaign is a partnership between The National Oceanic and Atmospheric Administration (NOAA), the Wyandotte County Public Health Department (WYCO PHD), and the Johnson County Department of Health and Environment (JCDHE) that seeks to understand the scope of Urban Heat Islands on the warmest day of the year.
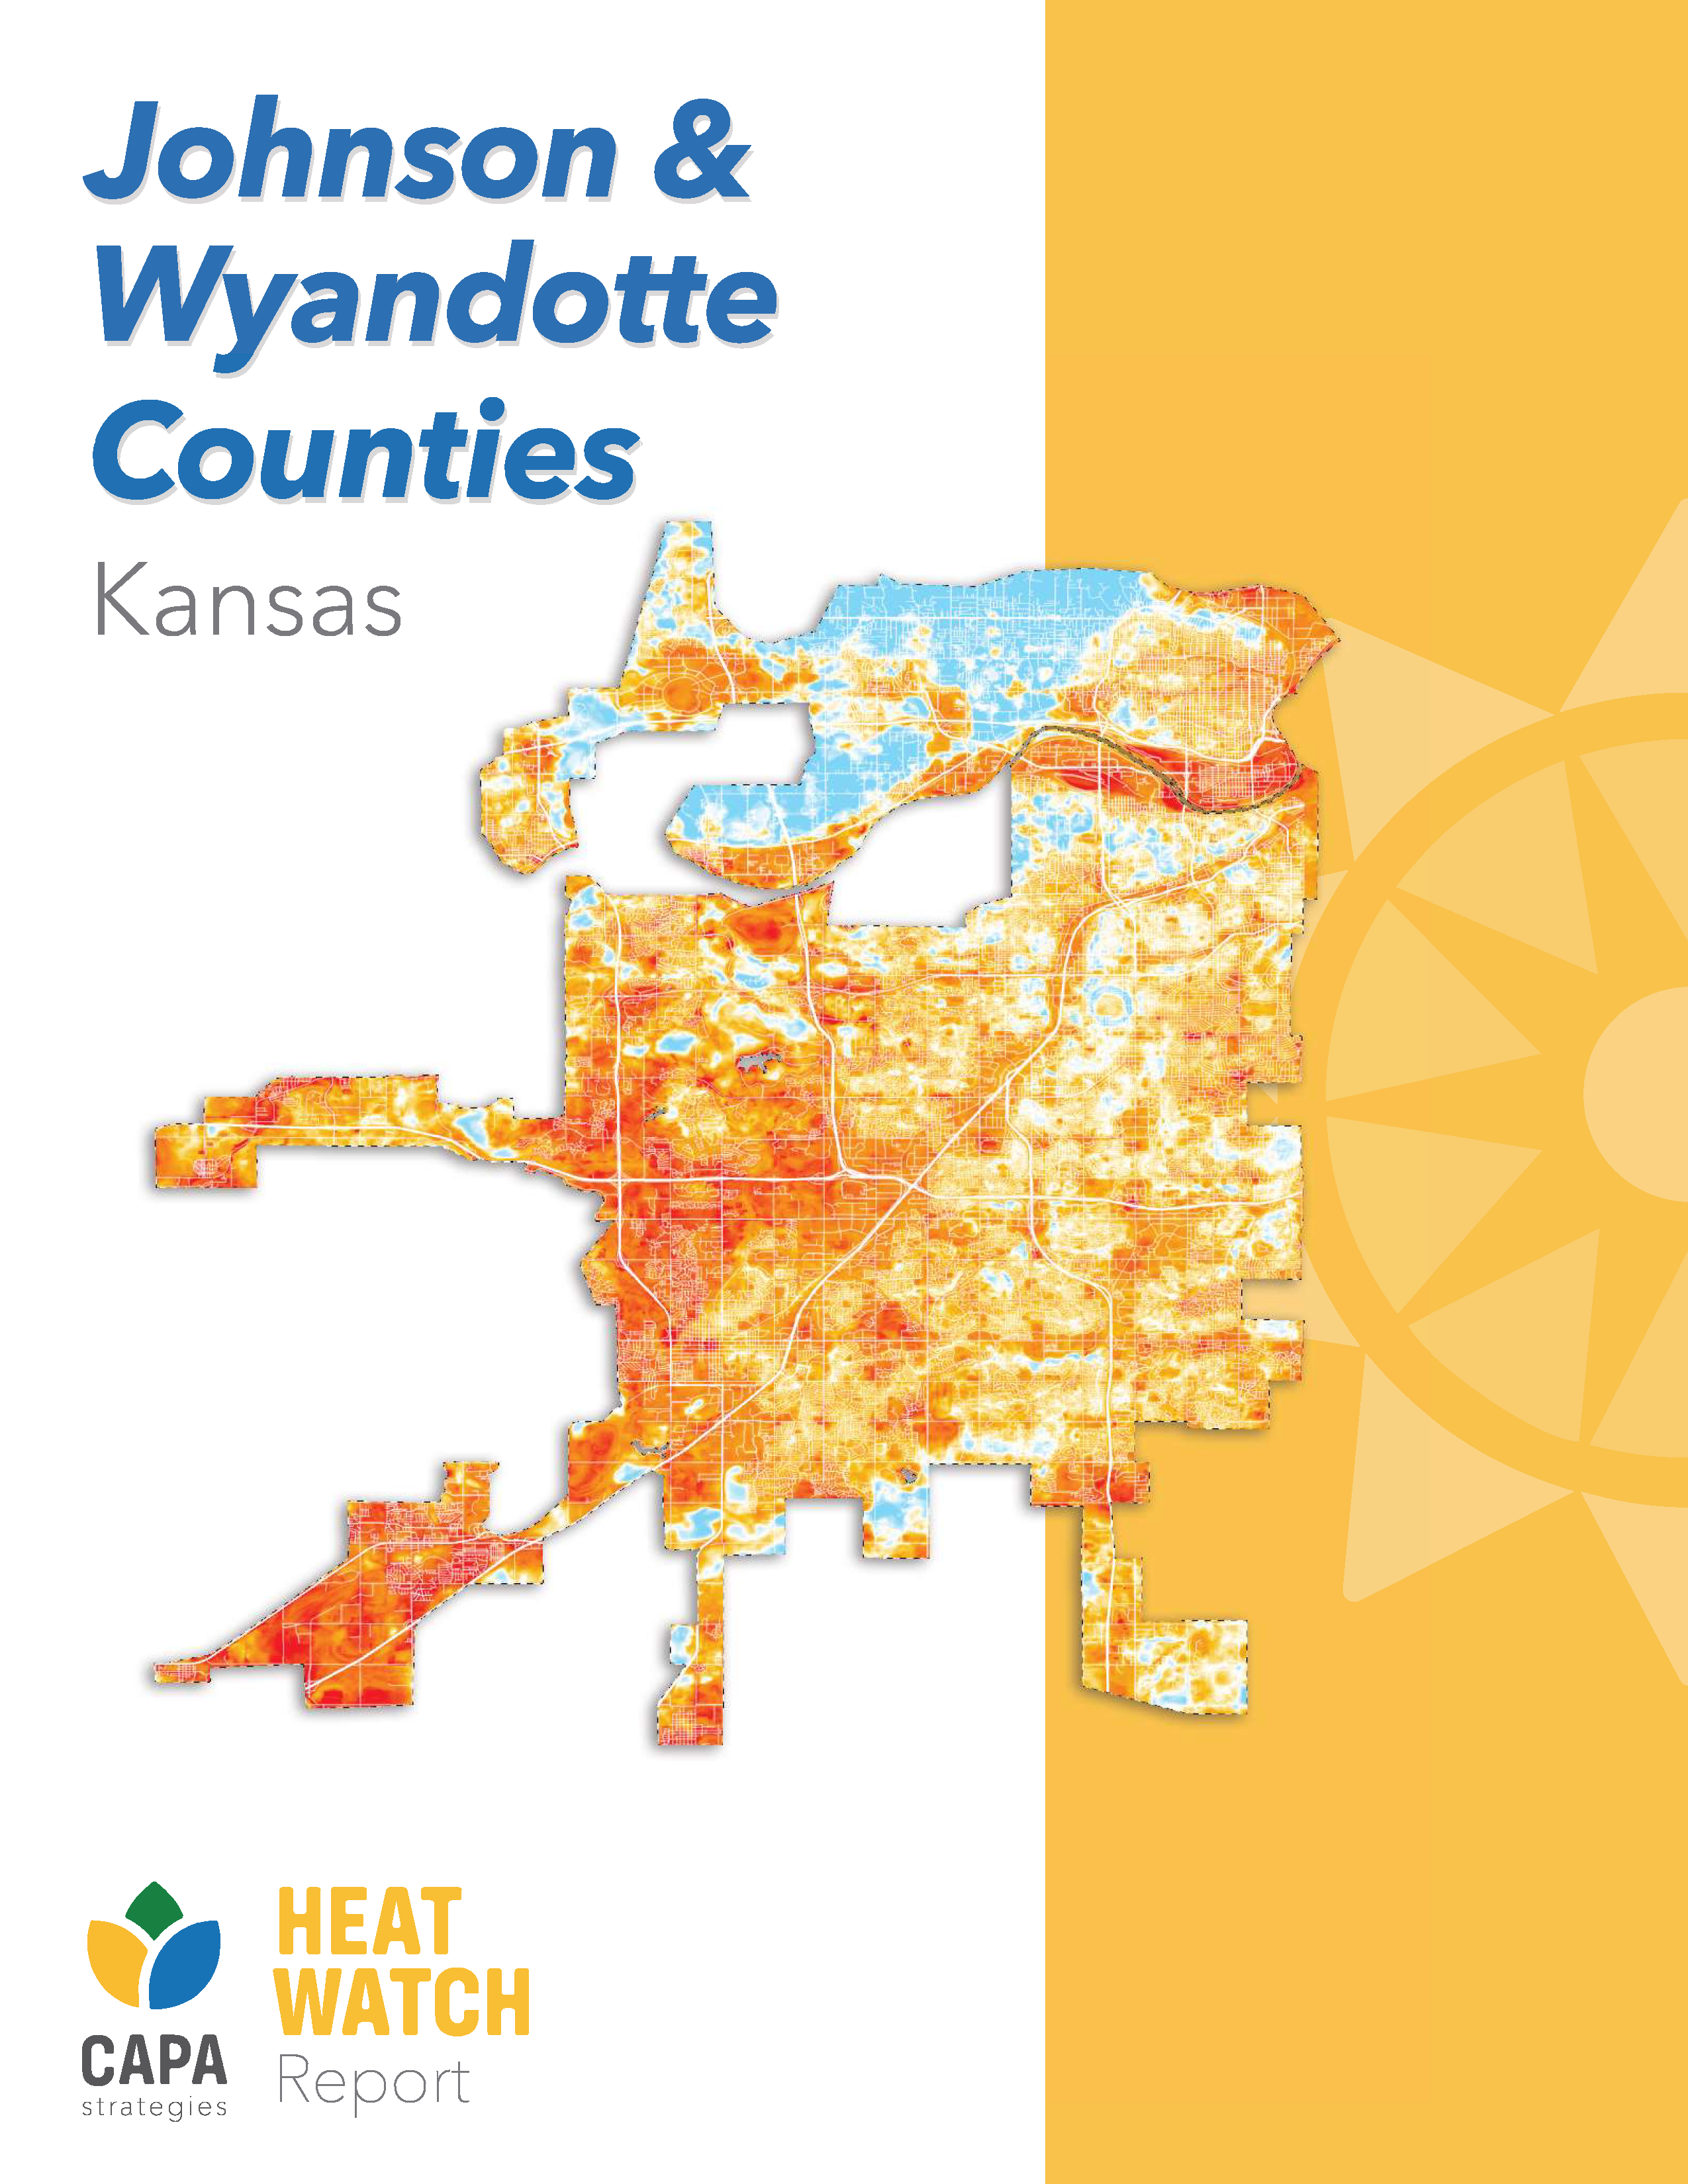
2023 Findings for Wyandotte and Johnson Counties
Wyandotte and Johnson Counties held the "Campaign Day" on August 12th, 2023, to map heat across both counties. On August 12th, 200 volunteers traveled 31 unique routes to collect over 200,000 temperature and humidity data points throughout 310 square miles of the two counties. Volunteers used sensors attached to their vehicles to collect the data. Thank you to all our volunteers who drove, navigated, and helped work at the heat hubs!
Heat Map Dashboard with Interactive Maps
Read the report summarizing the findings:
 (PDF, 14MB)
Click the image above to read the report.
Here are some key findings:
- There were large temperature differences between the hottest and coolest communities throughout the day, with the biggest difference, 11.7 degrees F, occurring in the evening.
- Though the recorded high temperature for the Kansas City metropolitan area on August 12th was 91 degrees F during the afternoon, the official records don’t tell the whole story. Data from the Heat Mapping Campaign clearly demonstrate that temperatures can vary substantially throughout communities in the region. At the hottest parts of the mapping area, the temperature approached 97 degrees F, and the coolest parts were about 85 degrees F.
- The heat index (what the temperature feels like when the effect of humidity on air temperature is included) reached over 100 degrees F in the hottest neighborhoods in the afternoon, while staying under 90 (89.7) degrees F in the coolest parts of the counties.
The report shares more detail on the findings. If you have experience with data analysis and are interested in seeing the data files, you can download the data files here.
Next steps
JCDHE and WYCO PHD will strategize with other departments, partners, and community members on ways to mitigate the dangers of extreme heat in area neighborhoods.
What is an Urban Heat Island?
Urban areas (in this case, the Kansas City Metro), often experience higher temperatures than rural areas due to the high density of buildings and roads. This is referred to as the urban heat island effect. Temperatures may even vary from neighborhood to neighborhood. Factors like humidity, tree coverage, green space, air flow, heavy traffic, and the density of buildings, asphalt, and concrete each contribute to how intense the heat feels to a member of our community.
Extreme heat poses a public health risk from heat-related illnesses and deaths, especially among those who work outside, athletes, pregnant people, children under 4, adults over 65, and low income households. Urban heat islands can cause an increase in the risk of heat related illness when compared to surrounding rural areas.
You can learn more about the urban heat island effect and other heat-related issues at heat.gov.
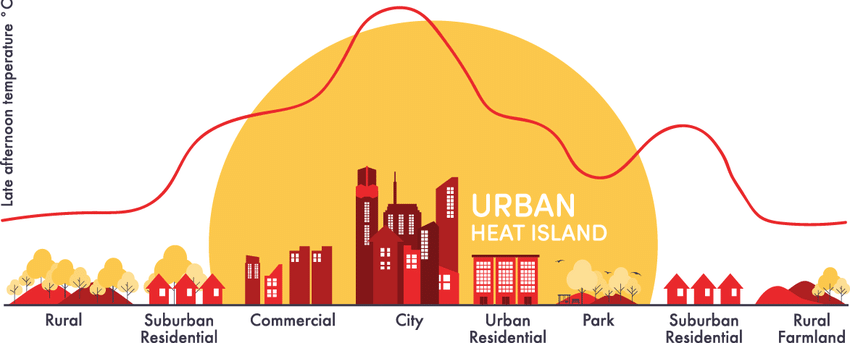
Image Credit: Kamyar Fuladlu, World Meteorological Organization
Other Organizations Involved in this Project
JCHDE and WYCO PHD are leading the Heat Mapping project in partnership with:
- Bridging the Gap
- CAPA Strategies
- City of Mission, Kan.
- City of Overland Park, Kan.
- CleanAirNow
- Groundwork Northeast Revitalization Group (Groundwork NRG)
- Heart to Heart International
- Johnson County Department of Technology & Innovation, Automated Information Mapping System group
- Johnson County Museum
- K-State Research and Extension, Johnson County
- Mid America Regional Council (MARC)
- National Oceanic and Atmospheric Administration (NOAA)
- National Weather Service (NWS)
- Unified Government of WyCo/KCK Department of Planning & Urban Design
- Unified Government of WyCo/KCK Department of Public Works